Class8 Flags 42,570 High-Risk Truck Unloads Using OEM Axle Weight Data
Startup analyzed 3.3 million unload events from 68,340 trucks, assigned suspicion scores using suspension load sensors, satellite imagery, and behavioral patterns. Arizona, North Dakota, and New Mexico ranked highest-risk.
How does Class8 detect suspicious truck unloads?
Class8 uses axle weight telemetry from OEM suspension load-sensing systems to flag significant weight drops while a truck is stopped. The system then validates each event with satellite imagery and behavioral analysis, assigning a suspicion score from 0 to 1. Events scoring 0.6 or higher are classified as High or Critical risk.
The company released a study covering 3,260,690 detected unload events collected from 68,340 commercial vehicles operating across 11,066 DOT entities. Of those, 42,570 events met the system's highest risk thresholds: 3,988 were classified as Critical risk (0.8 to 1.0) and 38,582 as High risk (0.6 to 0.8). Another 255,920 events fell into the Moderate risk category (0.4 to 0.6), 438,796 were Low risk (0.3 to 0.4), and 1,755,118 were Minimal risk (below 0.3).
Chris Atkinson, CEO of Class8, told FreightWaves that axle weight data from the truck's suspension load-sensing system is the primary metric that initiates the company's investigation. He said Class8 does not rely on axle weight as a standalone source of truth and instead validates the data against additional proprietary metrics.
Three-stage detection pipeline
The first stage analyzes vehicle weight telemetry to detect significant weight reductions while a truck is stopped. The system processes the telemetry to identify sustained load changes while filtering out normal sensor variation before determining whether an unload event should advance to the next stage.
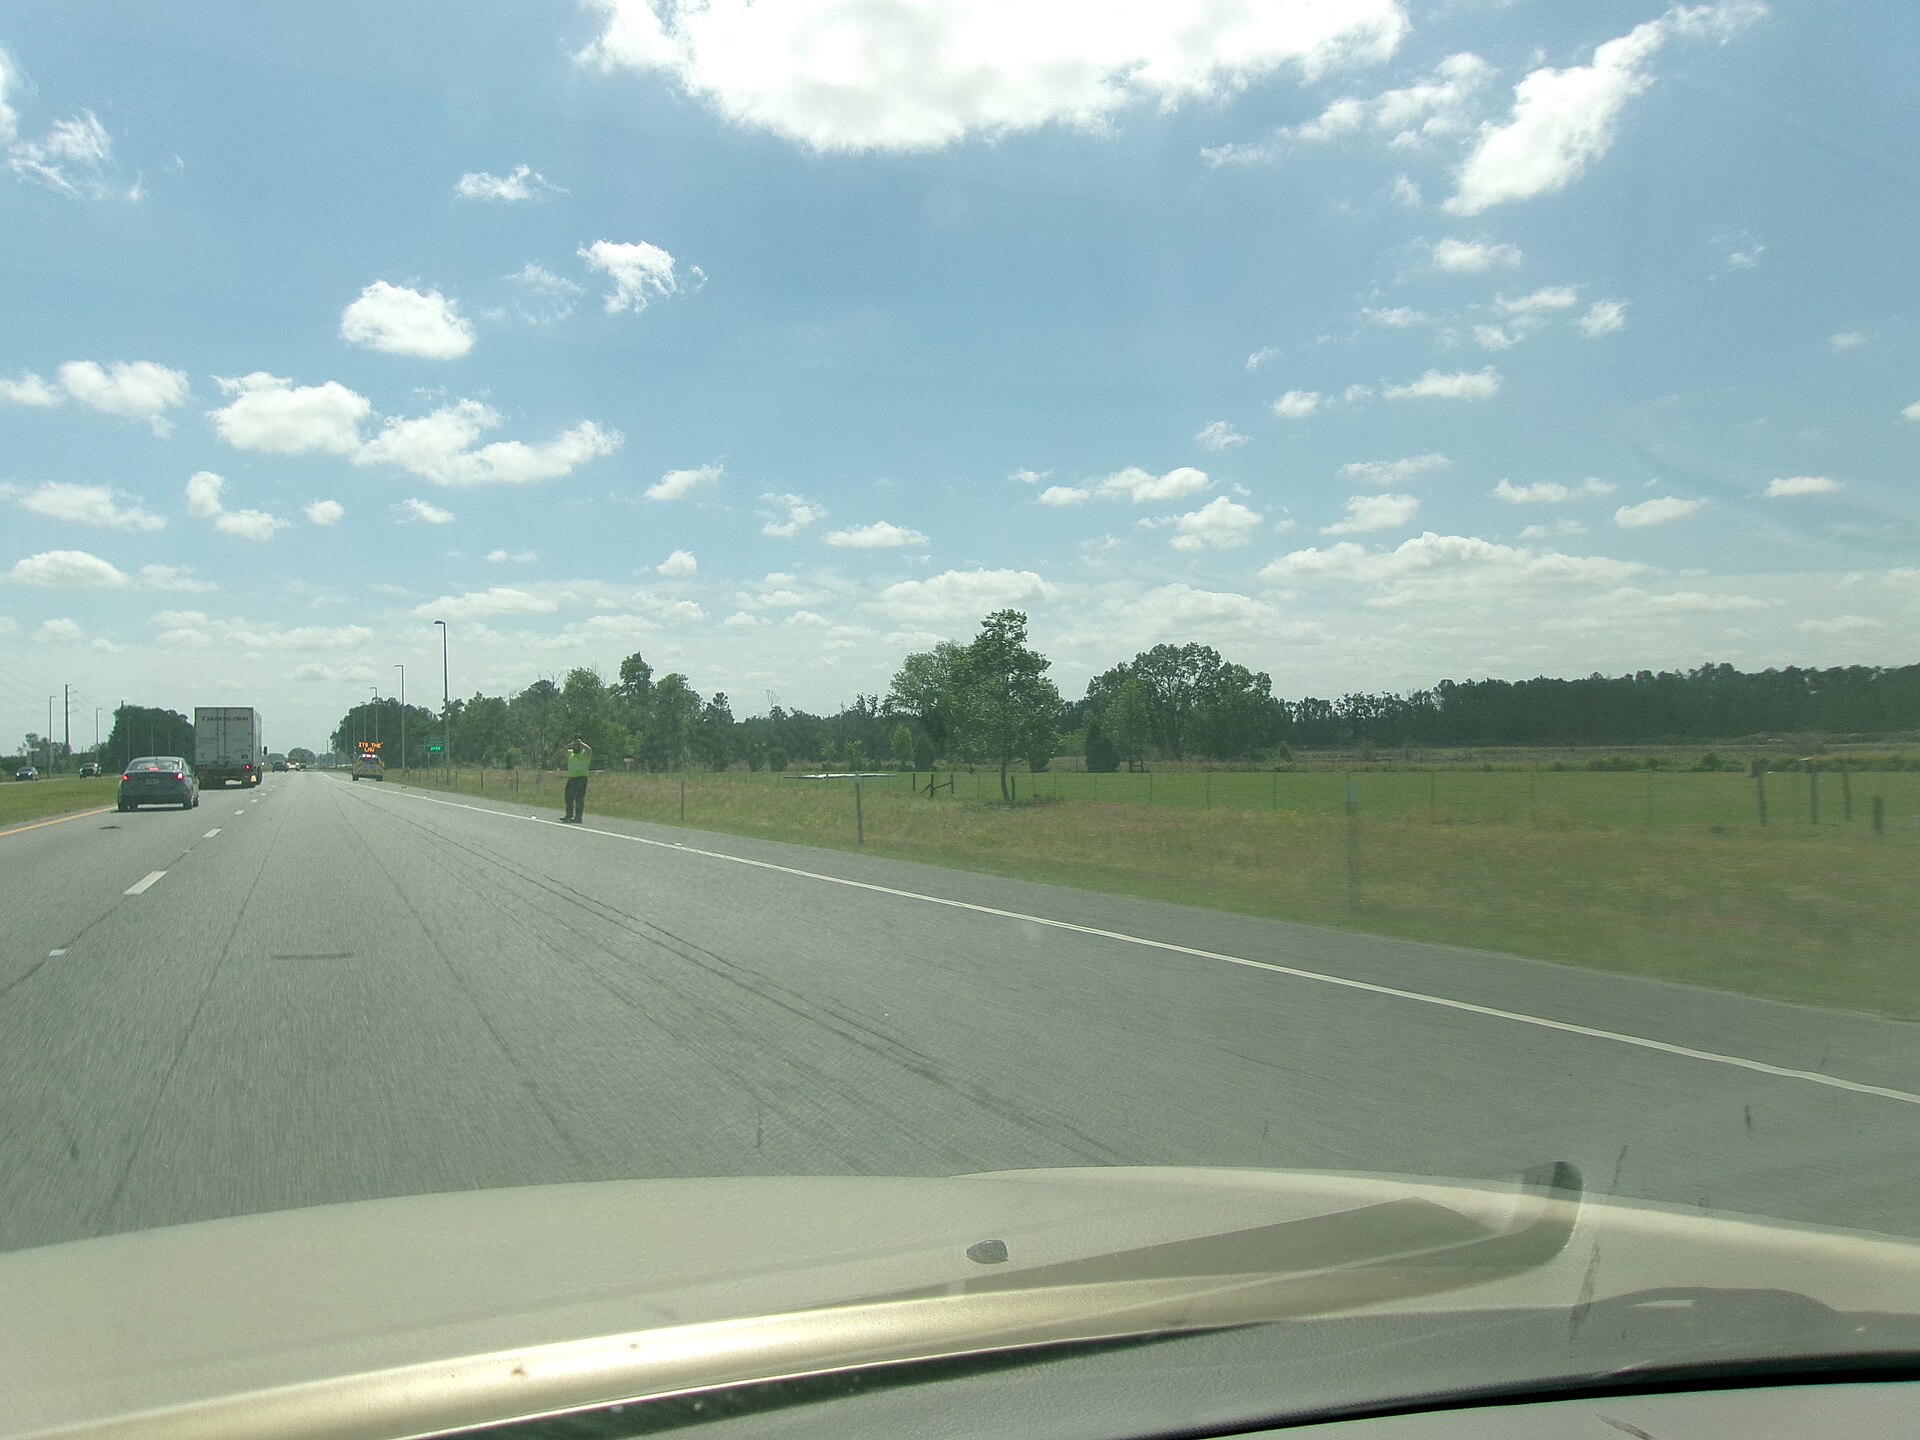
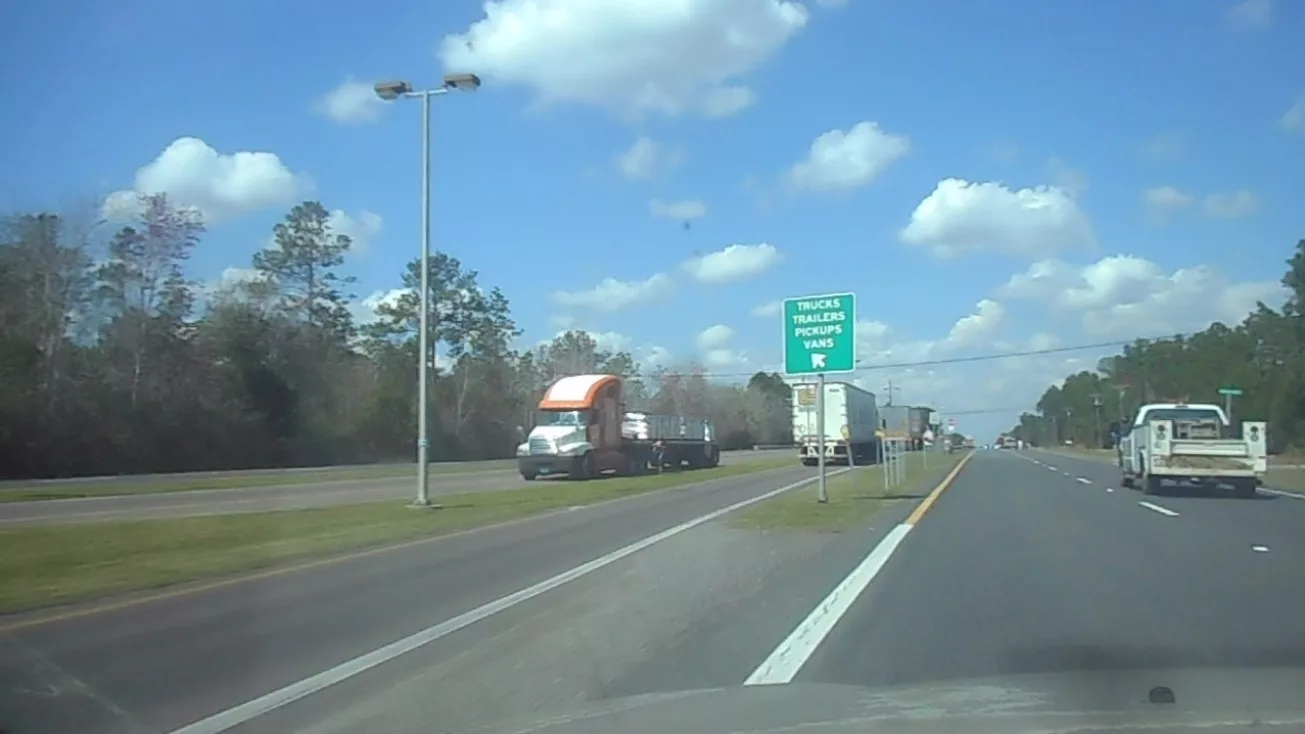
The second stage evaluates each detected unload location using satellite imagery. The imagery is analyzed to identify locations that differ from patterns commonly associated with warehouse depots and established freight facilities. Unload events occurring in remote areas, empty lots, and roadside pull-offs generally receive higher anomaly scores than unload events associated with warehouses, industrial parks, and distribution centers.
The third stage applies behavioral enrichment before assigning a final suspicion score. Additional weighting is applied for off-hours activity, geographic proximity clustering, and unload locations that differ from a vehicle's historical lane data. Each detected unload event is then assigned a continuous suspicion score ranging from 0 to 1, with the score determining its operational risk category.
Where high-risk unloads cluster
The distribution of High and Critical-risk unload events was not uniform across the United States. Based on average suspicion scores, Arizona, North Dakota, and New Mexico ranked among the highest-risk states identified in the analysis.
At the DAT Key Market Area level, Bismarck, North Dakota; Flagstaff, Arizona; Ontario, California; Green River, Wyoming; and Reno, Nevada recorded the highest average suspicion scores.
Unload events occurring between 8 p.m. and 6 a.m. exhibited both higher frequencies of High and Critical-risk activity and higher average suspicion scores than unload events occurring during standard business hours.
The report includes satellite image examples comparing locations assigned high suspicion scores with locations assigned low suspicion scores. High-scoring locations were characterized by remote terrain, empty lots, and roadside pull-offs, while low-scoring locations were associated with recognized freight facilities, truck stops, distribution centers, and industrial parks.
Validation and law enforcement plans
Atkinson told FreightWaves that Class8 has validated the model against a statistically significant number of confirmed cargo theft investigations. He declined to disclose the number of cases or provide specific examples. He also said the company is moving toward working with law enforcement agencies but has not yet begun those efforts.
The analytical framework is designed to identify unload events that may warrant further investigation by analyzing truck activity patterns rather than relying on manual reporting. The system evaluates vehicle weight telemetry, satellite imagery, and behavioral analysis to assign a suspicion score to each detected unload event.
What this means for fleets
For fleets already equipped with OEM suspension load-sensing systems, the hardware is in place. The question is whether carriers will grant third-party access to that telemetry stream. Class8's model depends on continuous axle weight data, which means fleets would need to authorize data sharing through telematics providers or directly with the analytics platform.
The system does not prevent theft. It flags unload events after they occur. A fleet running Class8's analysis would still need internal protocols to act on High or Critical-risk alerts, whether that means contacting the driver, dispatching a supervisor, or notifying law enforcement. The value proposition is speed: identifying a suspicious unload within hours instead of days, when cargo may still be recoverable.
Fleets operating in the five highest-risk DAT markets (Bismarck, Flagstaff, Ontario, Green River, Reno) or the three highest-risk states (Arizona, North Dakota, New Mexico) may see the most immediate benefit. For owner-operators running solo, the system would require buy-in from the carrier or broker they're hauling for, since individual drivers typically lack direct access to their own suspension telemetry in a format Class8 can ingest.
The off-hours finding aligns with existing cargo theft patterns: thieves prefer overnight and weekend windows when facilities are closed and response times are slower. A fleet running high-value loads through those time windows could use the suspicion score as a secondary check on driver behavior, though that raises the question of how to distinguish a legitimate breakdown or rest stop from a theft event without creating false positives that erode driver trust.